 Canada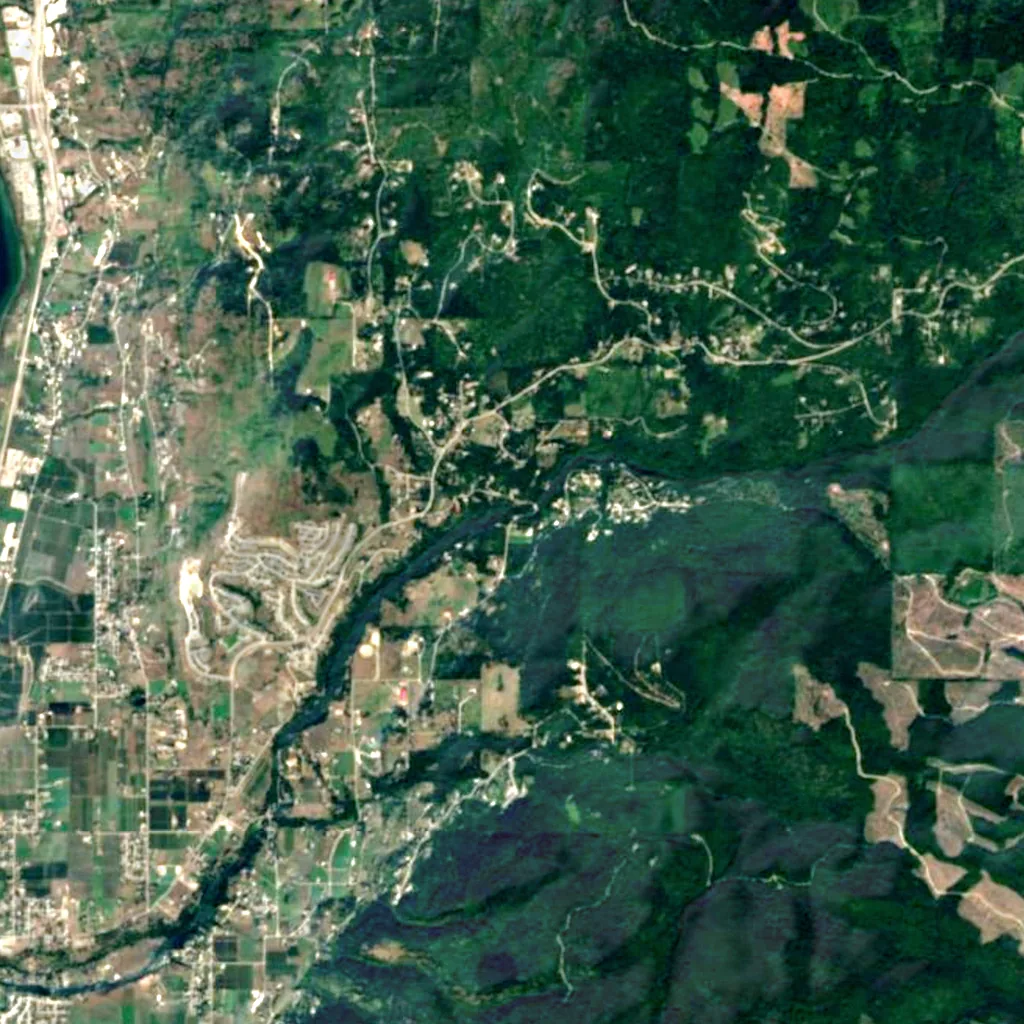
In numbers.
0.52m³/s
Average flow
estimate
Apr–Jun
Oct
Best months
689m
Elevation
The water at B.X. Falls, month by month
It roars from March to May.
The fullest months: from March to May, with the snowmelt. The thinnest: from August to September. Below −4 °C on average (from December to February): the falls can partly freeze.
- 0.6 m³/sJan
- 0.6 m³/sFeb
- 1.3 m³/sMar
- 1.3 m³/sApr
- 1.1 m³/sMay
- 0.9 m³/sJun
- 0.4 m³/sJul
- 0.2 m³/sAug
- 0.3 m³/sSep
- 0.5 m³/sOct
- 0.7 m³/sNov
- 0.9 m³/sDec
From about 0.16 m³/s in the lowest month to 1.3 m³/s in the highest. Best months to go, with plenty of water and pleasant days: from April to June and October.
Estimate: the timing comes from rain, snowmelt and evaporation (NASA POWER, 1991–2020); the amounts from the river model of HydroATLAS (WaterGAP, 1971–2000). Dams upstream can change the real flow.
Getting there.
- Vernonnearest town · 8.4 km in a straight line
- Parking 180 m awaynearest car park in OpenStreetMap, straight line
- Kelowna International Airport (YLW)nearest airport with scheduled flights · 42 km in a straight lineCar hire at YLW airport (Kelowna)Discover Cars · Affiliate link↗
- From April to June and Octoberbest months to go (estimate)
Plan your visit
Stay, explore and get there
Some links above are affiliate links: if you book through them we may earn a commission, at no extra cost to you. It never changes what the data on this page says.
Seen from the sky.
8 × 8 km of cloud-free satellite image, with what OpenStreetMap knows around the falls.
N
2 km
Sentinel-2 cloudless 2016 (EOX, CC BY 4.0), 8 × 8 km, north up. Points © OpenStreetMap contributors.
The line follows the river as mapped in OpenStreetMap; heights from the 30 m Copernicus model, which smooths narrow drops — the published height of the falls is the one above.
Around the falls the river drops 80 m in 1.8 km. Here the river runs about 51 m below the lower rim of its valley.
What is around.
- —viewpoints
- —waymarked walking routes
- 1car parks
- —swimming spots
- —picnic sites
- —toilets
- —information boards and visitor centres
- —bus stops within 1 km
- —other named waterfalls within 4 km
- —caves
- 7campsitesSilver Star Campground & RV Park, Swan Lake RV Park & Campground, Cedar Falls Campground and 4 more
- 2hotels, B&Bs and huts within 6 kmDays Inn by Wyndham Vernon, Riviera Plaza & Conference Centre, Vernon, BC
- —restaurants and cafés within 3 km
Counted in OpenStreetMap, the map anyone can edit, up to 2 km around the falls (unless noted). A low number may just mean nobody has mapped it yet. © OpenStreetMap contributors (ODbL).
Towns nearby
- Vernon8.4 km in a straight line
- Spallumcheen9.8 km in a straight line
- Coldstream11 km in a straight line
- Armstrong15 km in a straight line
- Lumby17 km in a straight line
Weather
The weather, month by month.
| Jan | Feb | Mar | Apr | May | Jun | Jul | Aug | Sep | Oct | Nov | Dec | |
|---|---|---|---|---|---|---|---|---|---|---|---|---|
| Afternoon °C | -2 | -1 | 4 | 11 | 18 | 22 | 27 | 27 | 20 | 11 | 3 | -3 |
| Night °C | -10 | -9 | -4 | 0 | 6 | 9 | 13 | 12 | 7 | 1 | -4 | -10 |
| Rain & snow (mm) | 65 | 43 | 53 | 43 | 55 | 68 | 36 | 28 | 45 | 62 | 70 | 65 |
| Wet days | 15 | 11 | 14 | 12 | 12 | 14 | 8 | 7 | 9 | 13 | 16 | 16 |
| Sun h/day | 1.6 | 4.1 | 5.5 | 6.7 | 7.7 | 7.9 | 10.3 | 9.4 | 6.7 | 3.8 | 1.3 | 1.1 |
| Snow on the ground (cm) | 35 | 36 | 22 | 10 | 3 | 0 | 0 | 0 | 0 | 9 | 17 | 22 |
Long-term averages 1991–2020 (NASA POWER) for a cell about 55 km wide, with temperatures carried to the height of the falls (689 m) at −6.5 °C per 1,000 m. Not a forecast.
Recent years
Wet years and dry years
Rain of each month as a share of the 1991–2020 average. A wet season above 100 % usually means a fuller waterfall.
| Jan | Feb | Mar | Apr | May | Jun | Jul | Aug | Sep | Oct | Nov | Dec | |
|---|---|---|---|---|---|---|---|---|---|---|---|---|
| 2020 | 184% | 139% | 62% | 60% | 185% | 169% | 172% | 70% | 64% | 153% | 97% | 150% |
| 2021 | 93% | 125% | 57% | 52% | 64% | 47% | 160% | 141% | 116% | 119% | 180% | 103% |
| 2022 | 121% | 96% | 89% | 71% | 127% | 175% | 124% | 159% | 24% | 56% | 94% | 111% |
| 2023 | 89% | 178% | 49% | 112% | 115% | 62% | 84% | 141% | 84% | 66% | 71% | 113% |
| 2024 | 139% | 162% | 76% | 109% | 87% | 126% | 79% | 255% | 98% | 139% | 151% | 147% |
| 2025 | 60% | 119% | 197% | 108% | 125% | 126% | 157% | 205% | 93% | 97% | 119% | 191% |
130% wetter than usual 70% drier than usual
Compare with the waterfalls nearby.
B.X. Falls
Canada
- —Height
- 0.52 m³/sAverage flow
- Apr–Jun, OctBest months
About these numbers
| Names, height, width, river | Wikidata (Q38732) · CC0 |
|---|---|
| River flow and catchment | HydroATLAS / RiverATLAS v1.0 (Linke et al. 2019) · CC BY 4.0 |
| Climate | NASA POWER, 1991–2020 |
| Relief, river profile, 3D model | Copernicus DEM GLO-30 · © DLR e.V., © Airbus Defence and Space GmbH, Copernicus/ESA |
| Paths, viewpoints, parking | © OpenStreetMap contributors · ODbL |
| Images | EOX Sentinel-2 cloudless 2016 · CC BY 4.0; Wikimedia Commons |
Every figure is an average, an estimate or a count from a public dataset. Licences and methods: data sources.
The family
Do you prefer beaches, lakes, mountains, waterfalls, islands, rivers or canyons?
Same idea, other landscapes: field atlases built on open data, month by month, in seven languages.
 beaches
 Find your beach: sea temperature, sun and swimming month by month.Visit
  lakes
lakes Every lake on Earth: water temperature, ice, depth and the shore.Coming soonVisit
  mountains
 Every summit in 3D: summit weather, the 0 °C line, huts and trails.Visit
  waterfalls
 Every waterfall: height, flow month by month and when it roars.You are here
 islands
 Every island from the sea up: size, sea temperature, ferries and 3D.Visit
  rivers
 Every river from source to sea: the journey, the flow and the basin in numbers.Visit
  canyons
 Every canyon cut to scale: depth to the floor, rim and floor temperatures, trails and viewpoints.Visit