 Slovenia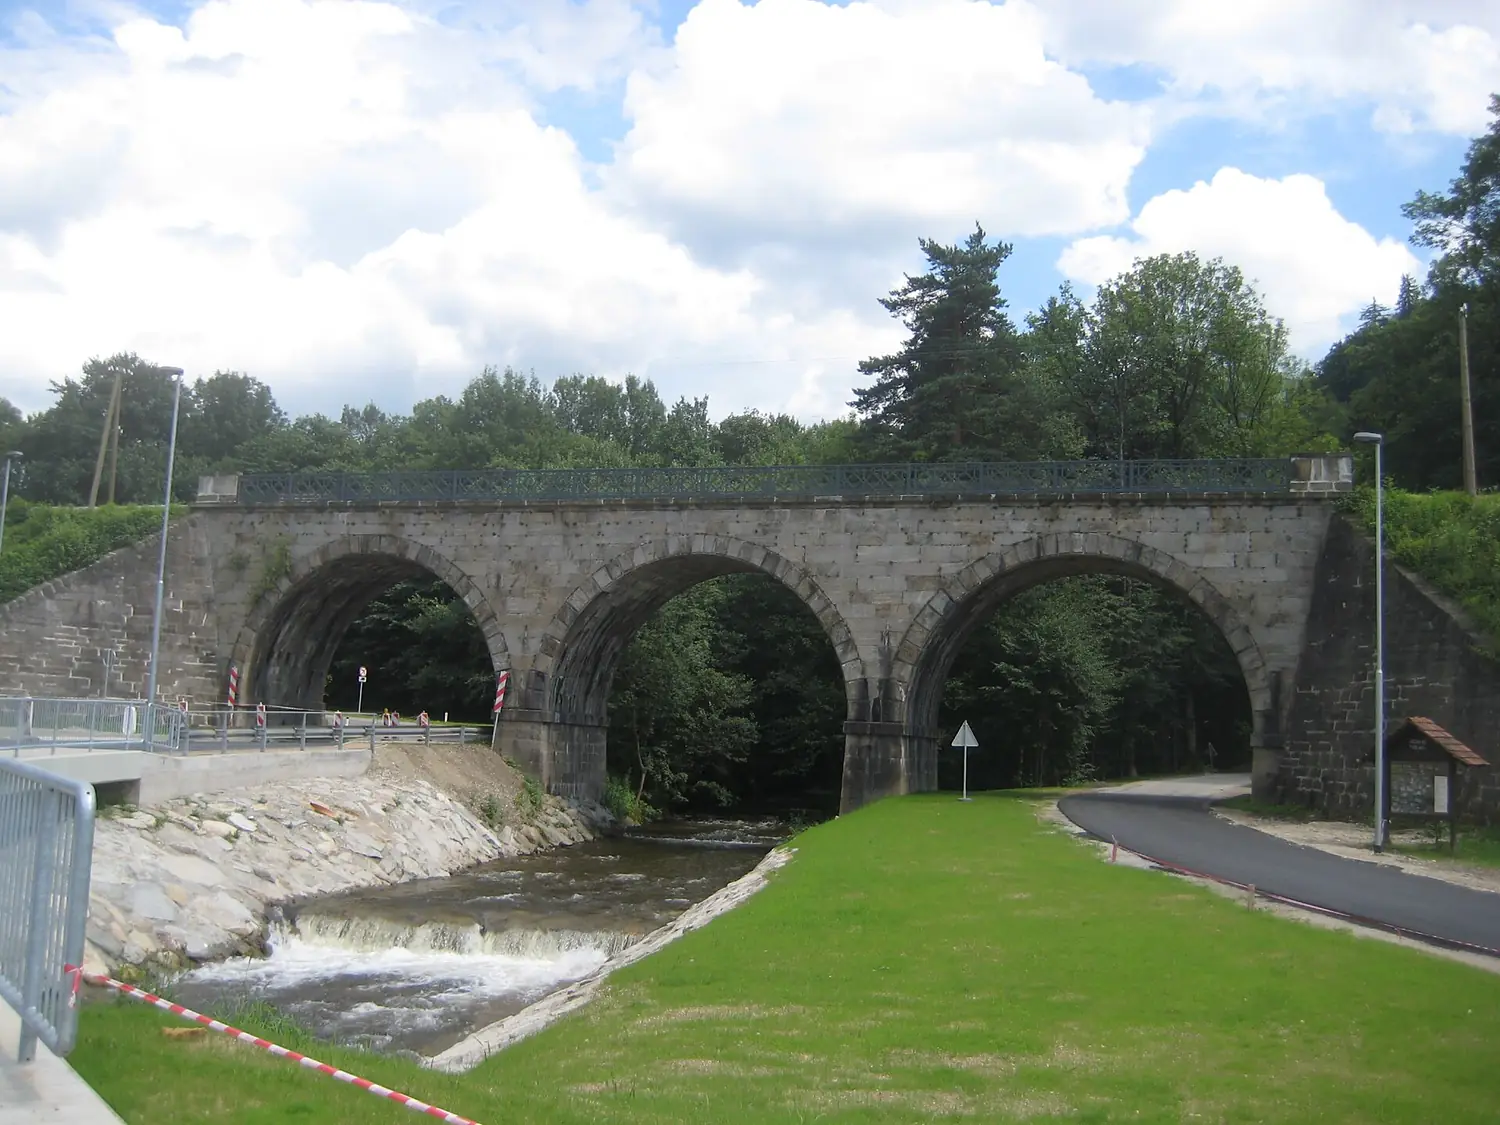
In numbers.
238m³/s
Average flow
estimate
May
Sep–Nov
Best months
274m
Elevation
The water at Lobnica (Drava), month by month
It roars from March to November.
It carries water fairly evenly through the year.
- 50 m³/sJan
- 110 m³/sFeb
- 285 m³/sMar
- 395 m³/sApr
- 462 m³/sMay
- 428 m³/sJun
- 399 m³/sJul
- 366 m³/sAug
- 513 m³/sSep
- 509 m³/sOct
- 459 m³/sNov
- 191 m³/sDec
From about 50 m³/s in the lowest month to 513 m³/s in the highest. Best months to go, with plenty of water and pleasant days: May and from September to November.
Estimate: the timing comes from rain, snowmelt and evaporation (NASA POWER, 1991–2020); the amounts from the river model of HydroATLAS (WaterGAP, 1971–2000). Dams upstream can change the real flow.
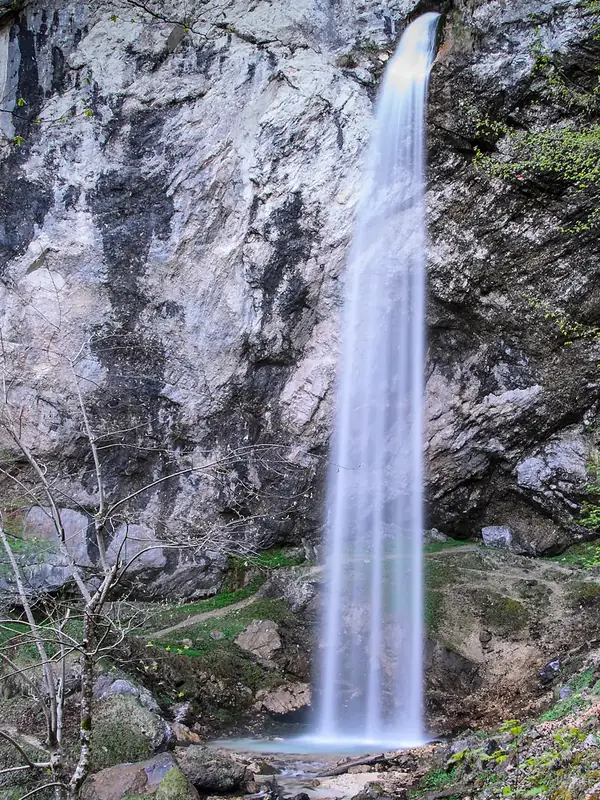
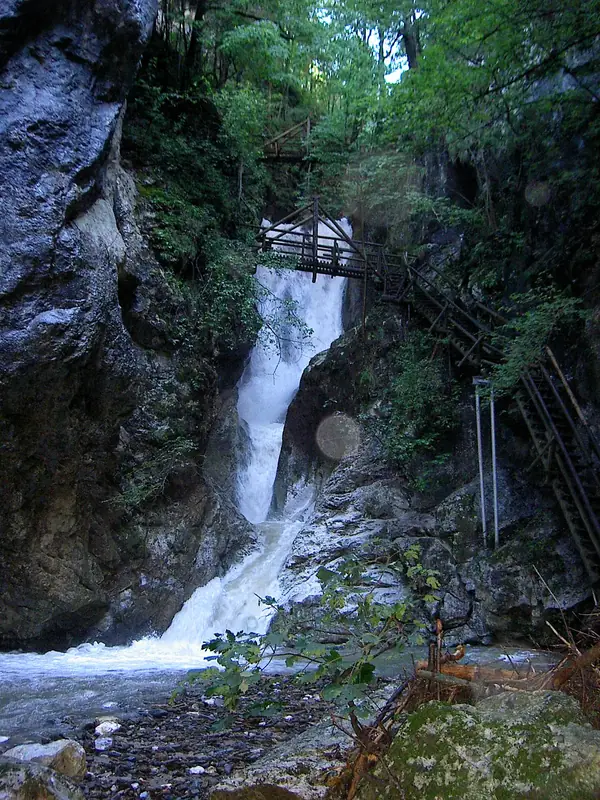
Lobnica (Drava) is a waterfall in Slovenia.
Getting there.
- Selnica ob Dravinearest town · 1.8 km in a straight line
- Parking 230 m awaynearest car park in OpenStreetMap, straight line
- Maribor Edvard Rusjan Airport (MBX)nearest airport with scheduled flights · 17 km in a straight lineCar hire at GRZ airport (Feldkirchen bei Graz)Discover Cars · Affiliate link↗
- May and from September to Novemberbest months to go (estimate)
Plan your visit
Stay, explore and get there
Some links above are affiliate links: if you book through them we may earn a commission, at no extra cost to you. It never changes what the data on this page says.
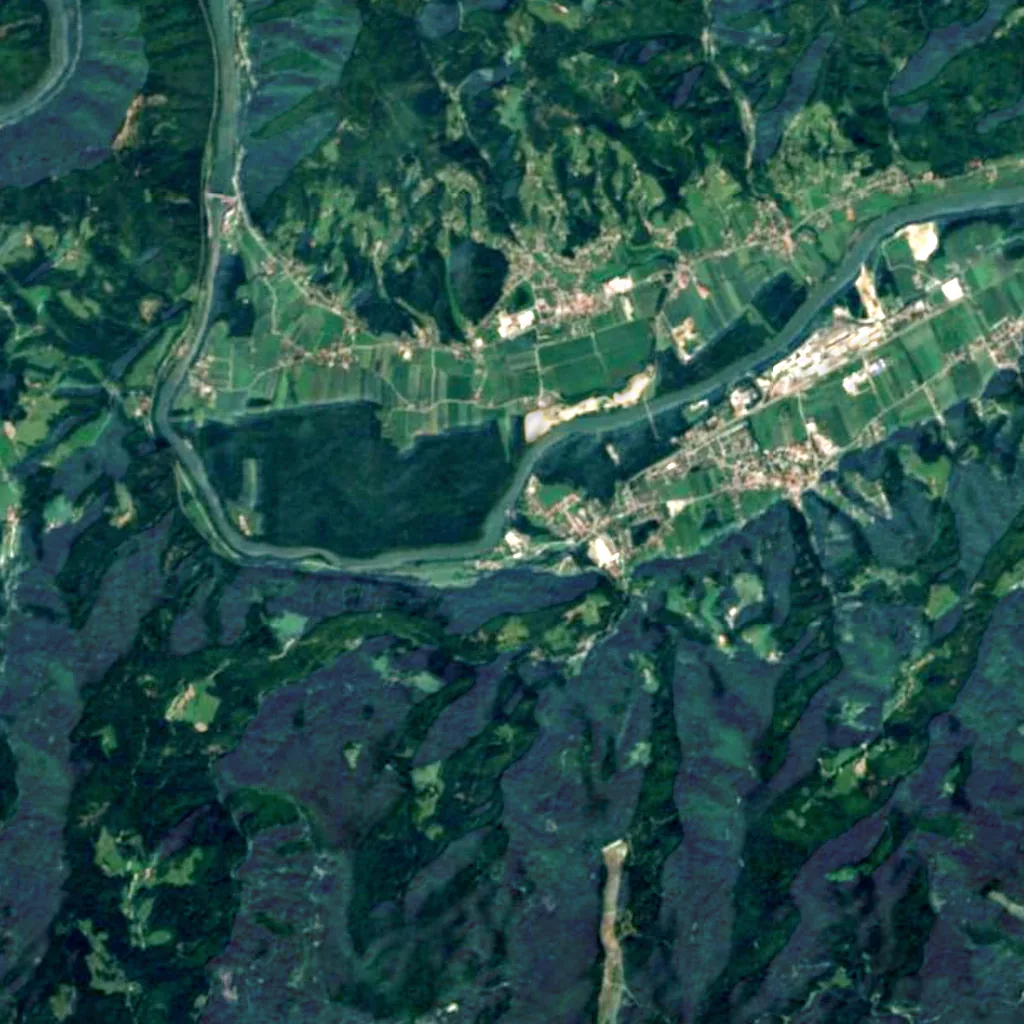
Seen from the sky.
8 × 8 km of cloud-free satellite image, with what OpenStreetMap knows around the falls.
 N
2 km
N
2 km
Sentinel-2 cloudless 2016 (EOX, CC BY 4.0), 8 × 8 km, north up. Points © OpenStreetMap contributors.
The line follows the river as mapped in OpenStreetMap; heights from the 30 m Copernicus model, which smooths narrow drops — the published height of the falls is the one above.
Around the falls the river drops 15 m in 0.6 km. Here the river runs about 16 m below the lower rim of its valley.
What is around.
- 3viewpoints
- 9waymarked walking routesRuška planinska pot, Gozdna učna pot Uršank, Aljaževa pot and 6 more
- 46car parks
- —swimming spots
- 4picnic sites
- —toilets
- 4information boards and visitor centres
- 4bus stops within 1 km
- 1other named waterfalls within 4 kmPlazovnik
- —caves
- —campsites
- 17hotels, B&Bs and huts within 6 kmŠport hotel Areh, Zarja, Andrejev dom "Pajk" and 14 more
- 9restaurants and cafés within 3 km
Counted in OpenStreetMap, the map anyone can edit, up to 2 km around the falls (unless noted). A low number may just mean nobody has mapped it yet. © OpenStreetMap contributors (ODbL).
Towns nearby
- Selnica ob Dravi1.8 km in a straight line
- Ruše2.5 km in a straight line
- Bistrica ob Dravi5.2 km in a straight line
- Lovrenc na Pohorju7.2 km in a straight line
- Limbuš7.7 km in a straight line
- Bresternica7.7 km in a straight line
- Pekre8.5 km in a straight line
- Kamnica11 km in a straight line
Weather
The weather, month by month.
| Jan | Feb | Mar | Apr | May | Jun | Jul | Aug | Sep | Oct | Nov | Dec | |
|---|---|---|---|---|---|---|---|---|---|---|---|---|
| Afternoon °C | 3 | 5 | 10 | 16 | 21 | 25 | 28 | 27 | 22 | 16 | 9 | 4 |
| Night °C | -4 | -3 | 0 | 5 | 10 | 15 | 17 | 16 | 11 | 6 | 2 | -3 |
| Rain & snow (mm) | 42 | 54 | 55 | 63 | 97 | 99 | 101 | 102 | 110 | 80 | 75 | 56 |
| Wet days | 6 | 7 | 8 | 11 | 14 | 15 | 14 | 13 | 11 | 10 | 10 | 8 |
| Sun h/day | 2.9 | 4.1 | 5.3 | 6.1 | 6.9 | 7.9 | 8.4 | 7.5 | 5.6 | 4.4 | 2.4 | 2.3 |
| Snow on the ground (cm) | 16 | 14 | 7 | 2 | 0 | 0 | 0 | 0 | 0 | 1 | 6 | 14 |
Long-term averages 1991–2020 (NASA POWER) for a cell about 55 km wide, with temperatures carried to the height of the falls (274 m) at −6.5 °C per 1,000 m. Not a forecast.
Photos
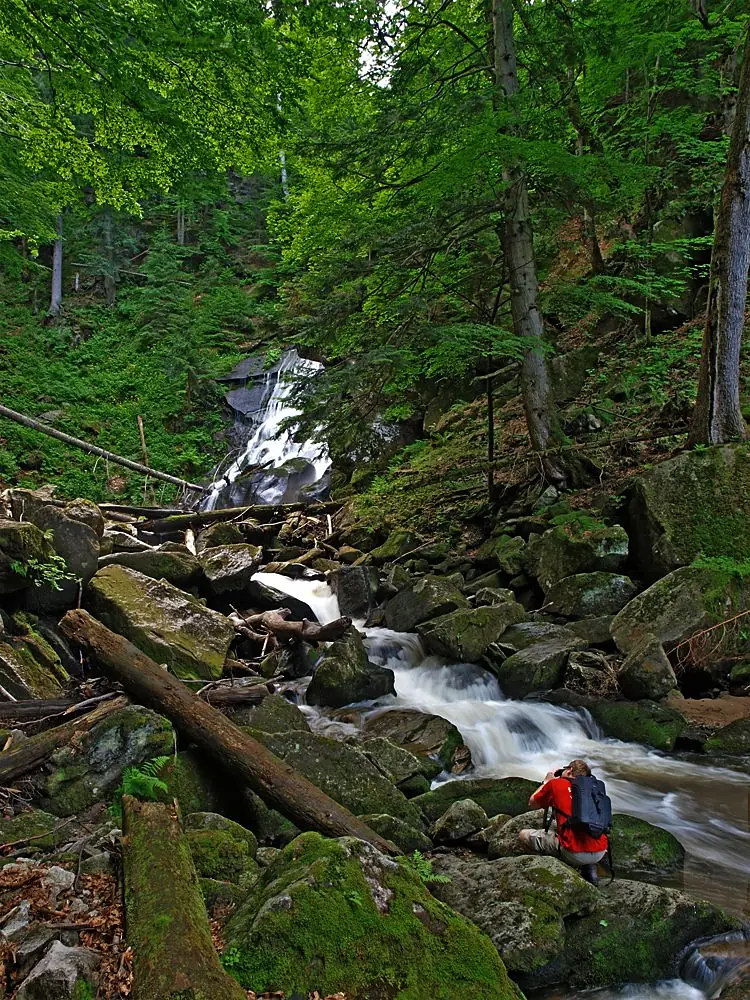
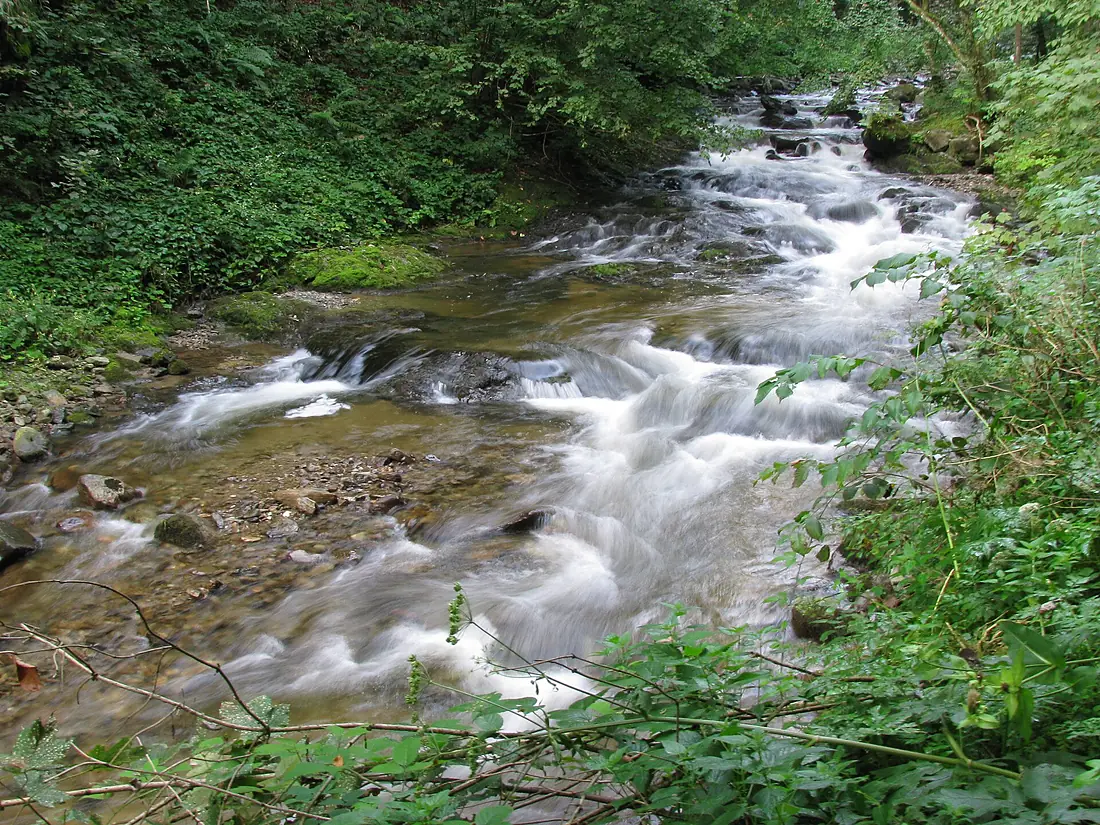
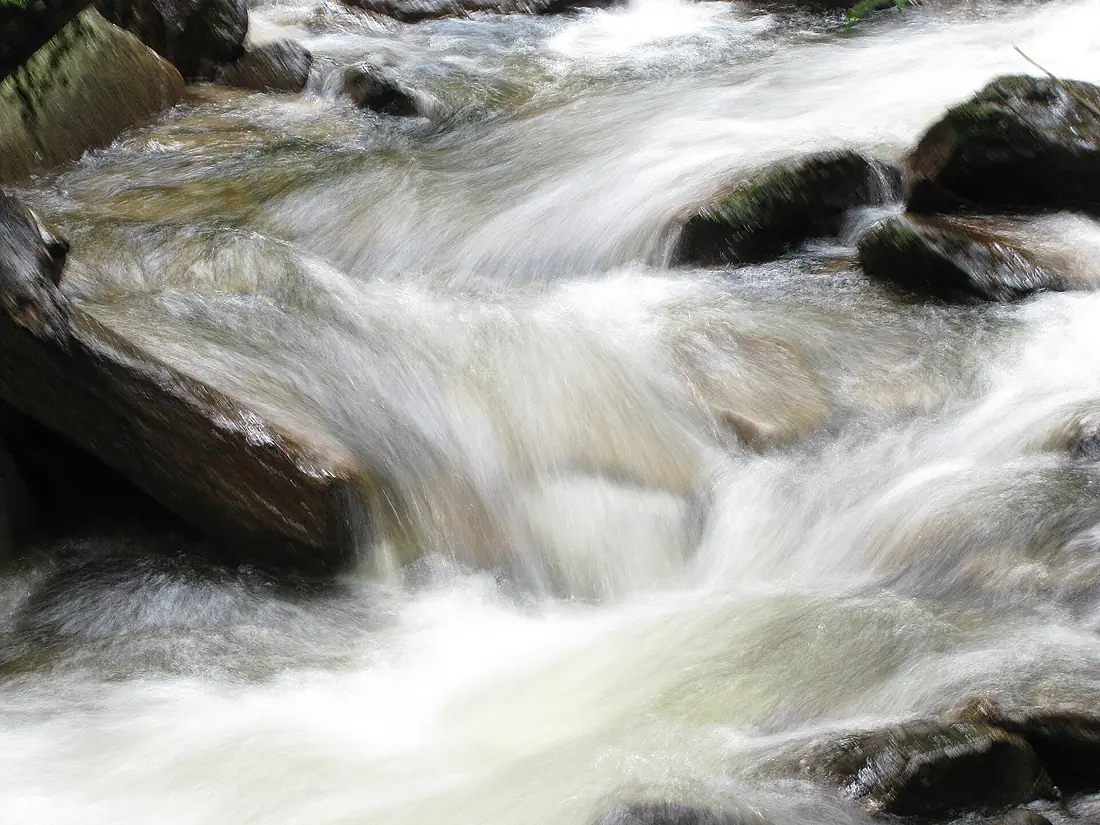
Through visitors' eyes.
Recent years
Wet years and dry years
Rain of each month as a share of the 1991–2020 average. A wet season above 100 % usually means a fuller waterfall.
| Jan | Feb | Mar | Apr | May | Jun | Jul | Aug | Sep | Oct | Nov | Dec | |
|---|---|---|---|---|---|---|---|---|---|---|---|---|
| 2020 | 31% | 47% | 67% | 42% | 66% | 98% | 134% | 117% | 69% | 157% | 43% | 187% |
| 2021 | 128% | 51% | 50% | 88% | 167% | 25% | 76% | 100% | 46% | 78% | 112% | 124% |
| 2022 | 54% | 45% | 50% | 111% | 83% | 85% | 69% | 73% | 156% | 32% | 103% | 150% |
| 2023 | 317% | 37% | 126% | 141% | 151% | 120% | 188% | 152% | 35% | 108% | 104% | 158% |
| 2024 | 150% | 50% | 143% | 95% | 140% | 95% | 94% | 52% | 153% | 117% | 57% | 40% |
| 2025 | 101% | 79% | 173% | 89% | 81% | 35% | 107% | 66% | 92% | 84% | 102% | 67% |
130% wetter than usual 70% drier than usual
Compare with the waterfalls nearby.
Lobnica (Drava)
Slovenia
- —Height
- 238 m³/sAverage flow
- May, Sep–NovBest months
About these numbers
| Names, height, width, river | Wikidata (Q3448263) · CC0 |
|---|---|
| River flow and catchment | HydroATLAS / RiverATLAS v1.0 (Linke et al. 2019) · CC BY 4.0 |
| Climate | NASA POWER, 1991–2020 |
| Relief, river profile, 3D model | Copernicus DEM GLO-30 · © DLR e.V., © Airbus Defence and Space GmbH, Copernicus/ESA |
| Paths, viewpoints, parking | © OpenStreetMap contributors · ODbL |
| Images | EOX Sentinel-2 cloudless 2016 · CC BY 4.0; Wikimedia Commons |
Every figure is an average, an estimate or a count from a public dataset. Licences and methods: data sources.
The family
Do you prefer beaches, lakes, mountains, waterfalls, islands, rivers or canyons?
Same idea, other landscapes: field atlases built on open data, month by month, in seven languages.
 beaches
 Find your beach: sea temperature, sun and swimming month by month.Visit
  lakes
lakes Every lake on Earth: water temperature, ice, depth and the shore.Coming soonVisit
  mountains
 Every summit in 3D: summit weather, the 0 °C line, huts and trails.Visit
  waterfalls
 Every waterfall: height, flow month by month and when it roars.You are here
 islands
 Every island from the sea up: size, sea temperature, ferries and 3D.Visit
  rivers
 Every river from source to sea: the journey, the flow and the basin in numbers.Visit
  canyons
 Every canyon cut to scale: depth to the floor, rim and floor temperatures, trails and viewpoints.Visit